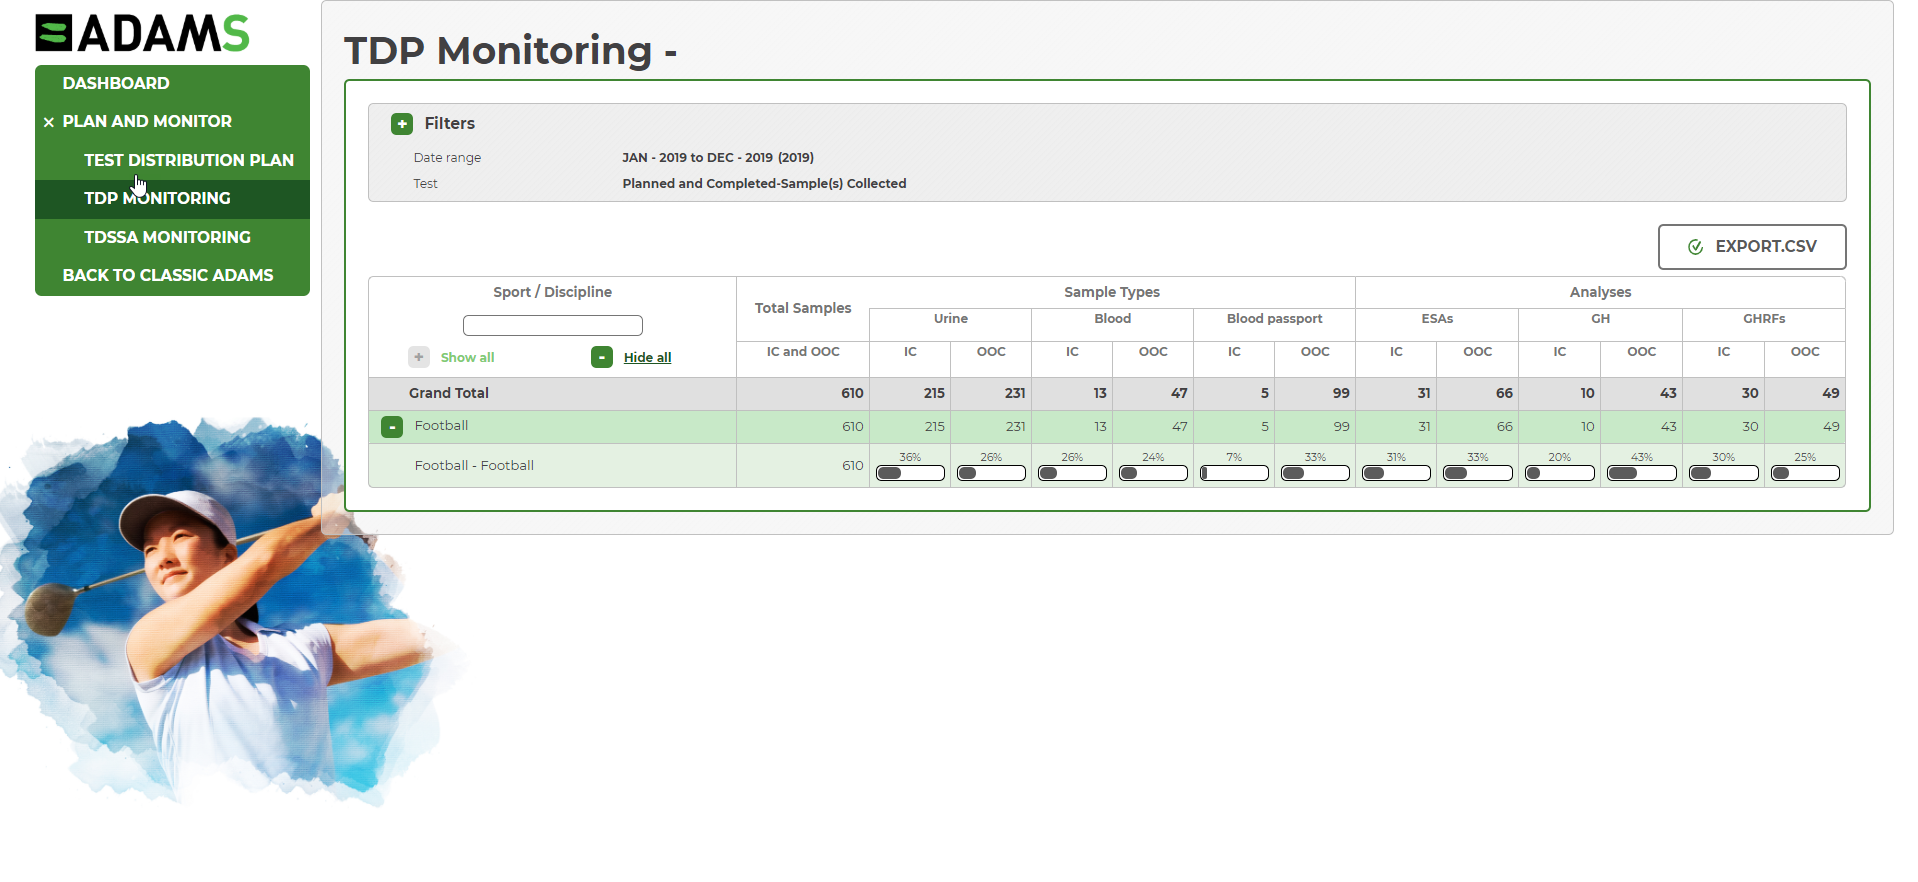
The TDP Monitoring tool compares your organizations total samples and analysis with those that you’ve forecasted for in the TDP. It will take the value you have planned for in your specific sport/discipline and compare it to the number of samples and analyses which have been completed, in your Doping Control Forms.
If you see a bullet graph in a cell in your TDP monitoring module, it means your organization has created a forecast for that sport/discipline, but if you only see a number, it means there is no forecast and that number represents the number of samples/analysis that are in your DCF’s in that period of time.

By clicking on the green + symbol, you will find filters that are also available for your data. Want to see your results in a custom date range, then just select your dates and your results will automatically update themselves. Want your data to have only tests which are completed in your DCF’s, you’re one click away with our test filter.

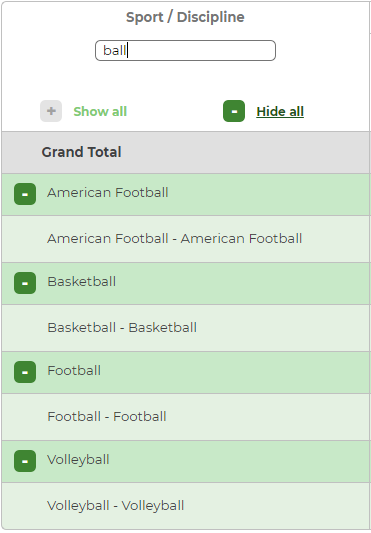
Also you may filter to locate easily a sport/discipline.
